Consecutive span of migration lines with (either time) absolute curvature, exceeding a certain threshold, define a meander. The lower the threshold the fewer longer meanders are detected. The higher the threshold, the fewer extremely bending meanders are detecting. We can maximize the number of detectable meanders by varying the threshold as shown on Figure 1.
Figure 1: Curvature threshold as it affects # of meanders
The following snippet will do this.
library(rgdal)
Original <- readOGR("..", "lower_mn_1938")
Final <- readOGR("..", "lower_mn_2009")
Years <- 71
spar <- 0.4
Step_pattern <- 'symmetricP05'
Curvature_multiplier <- 1e5
Step <- 25
source('~/.qgis2/processing/rscripts/Channel migration.rsx')
ff <- function(Min_curvature) {
  source('~/.qgis2/processing/rscripts/Meander enumeration.rsx', TRUE)
  max(Enumerated$bend, na.rm=TRUE)
}
mc <- 10^(seq(-4,-2, by=.1))
nb <- sapply(mc, ff)
plot(nb~mc, log='x', xlab='Minimal curvature threshold', ylab='Number of meanders detected')
Figure 2: # of meanders as a function of curvature threshold
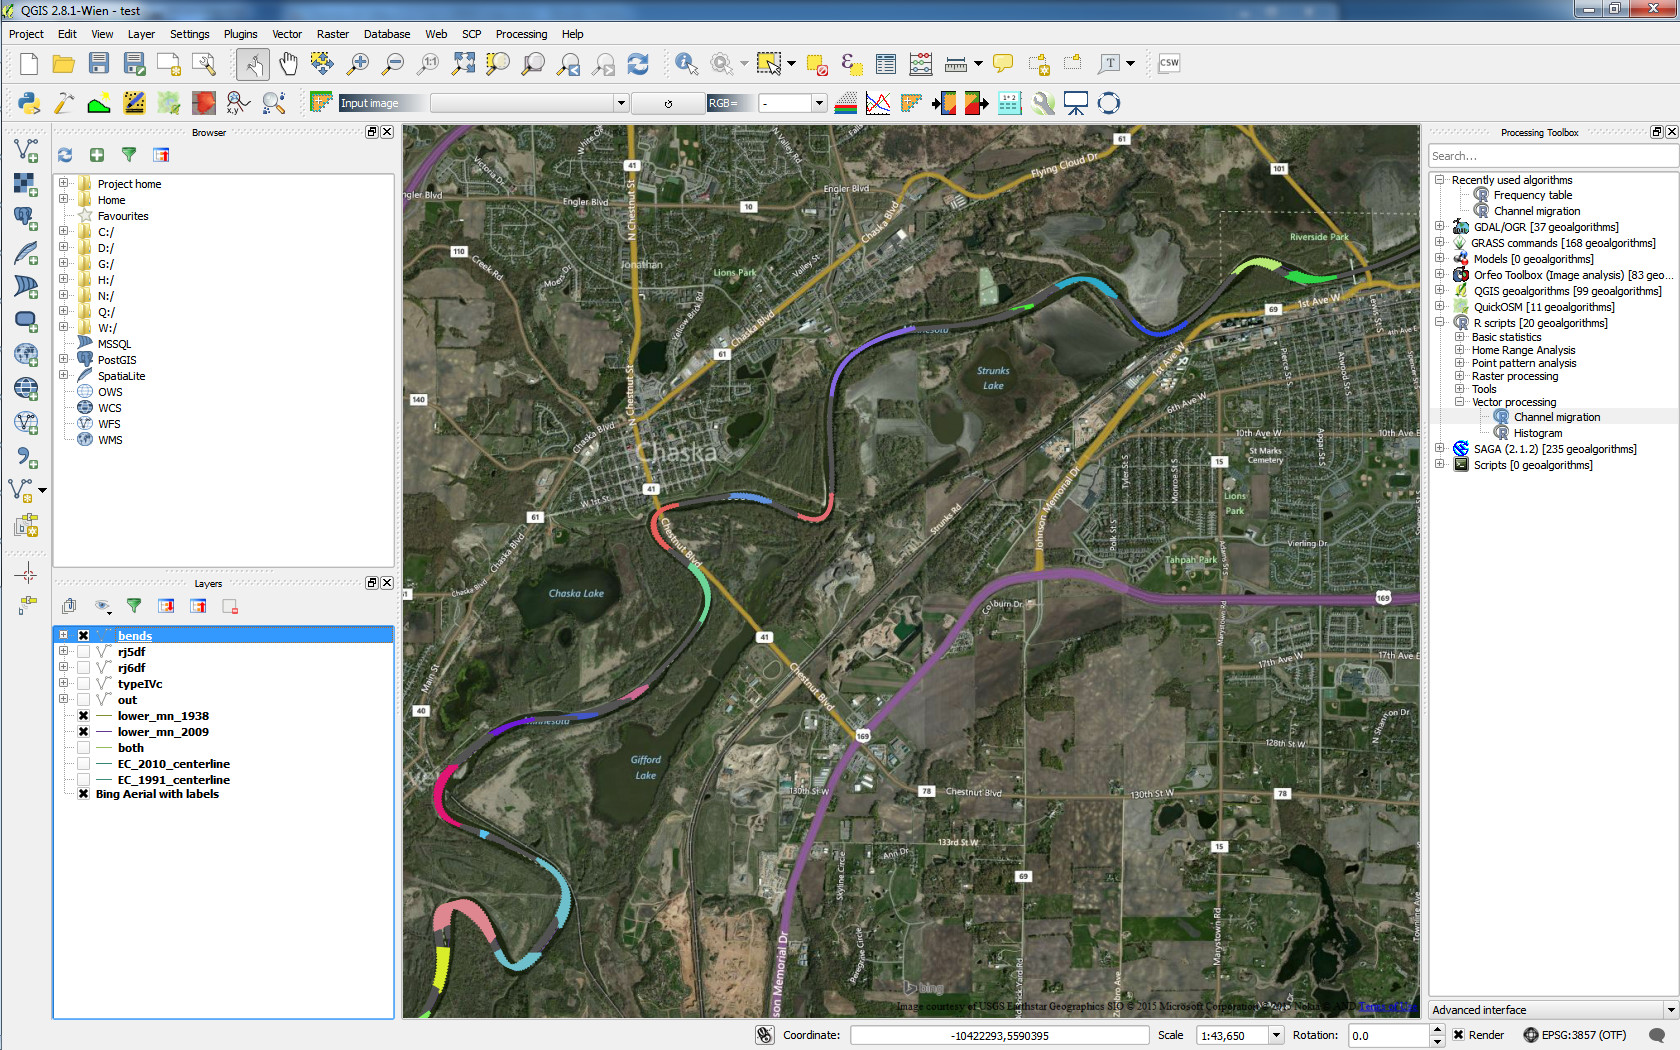
It is, probably, okay to use threshold value of 1e-3 as can be seen in Figure 2. Resulting migration lines with enumerated meanders are shown in Figure 3.

Figure 3: Example of enumerated meanders highlighted with different colors